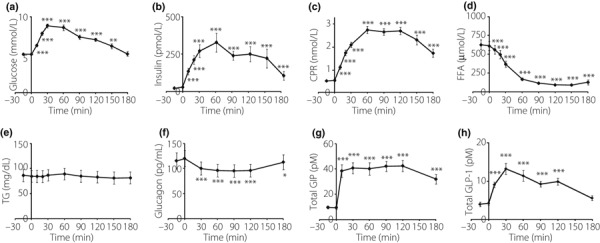
Figure 1.

Concentrations of (a) plasma glucose, (b) serum immunoreactive insulin, (c) serum C‐peptide reactivity (CPR), (d) serum free fatty acid (FFA), (e) serum triglyceride (TG), (f) glucagon, (g) total gastric inhibitory polypeptide (GIP) and (h) total glucagon‐like peptide‐1 (GLP‐1) during oral glucose tolerance test in 17 Japanese subjects. Mean ± SE, *P < 0.05, **P < 0.01, ***P < 0.001 vs the levels at fasting.
