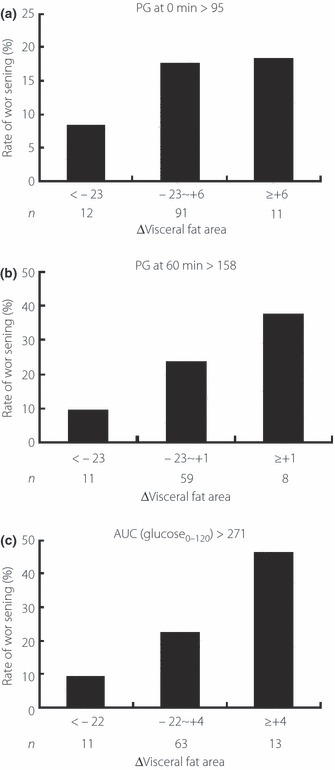
Figure 3.

Rates of worsening of glucose tolerance in subjects with (a) normal glucose tolerance and plasma glucose (PG) at 0 min of >95 mg/dL, (b) PG at 60 min of >158 mg/dL, (c) and area under the curve (AUC; glucose0–120) of >271 mg h/dL in an oral glucose tolerance test. ΔVisceral fat area indicates the increment in VFA from 2004 to 2005 in each subject. n, number of subjects.
