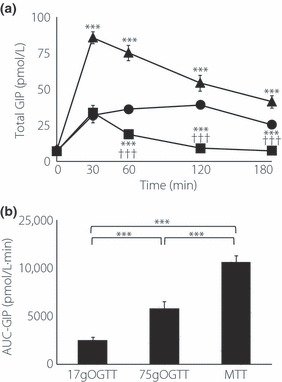
Figure 3.

(a) Concentrations of total gastric inhibitory polypeptide (GIP) during 75 g oral glucose tolerance test (OGTT; closed circle), 17 g OGTT (closed square) and meal tolerance test (MTT; closed triangle) in 10 Japanese subjects. Asterisks indicate significant differences vs 75 g OGTT at individual time‐points (*P < 0.05, **P < 0.01, ***P < 0.001); daggers indicate significant differences vs MTT at individual time‐points (†P < 0.05, ††P < 0.01, †††P < 0.001). (b) Area under the curve (AUC)‐GIP was calculated by the trapezoidal rule. Asterisks indicate significant differences at individual time‐points (*P < 0.05, **P < 0.01, ***P < 0.001). Statistical analyses were carried out using anova and unpaired Student’s t‐test. P‐values <0.05 were considered statistically significant. Data are presented as mean ± standard error.
