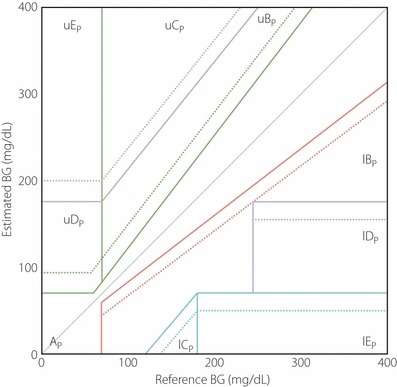
Figure 2.

The point‐error grid analysis (P‐EGA) divided into AP, BP, CP, DP and EP for sensor blood glucose (SBG) vs reference blood glucose (RBG). The P‐EGA zones are defined based on the reference rate of changes in blood glucose. l, Lower; p, point; u, upper.
