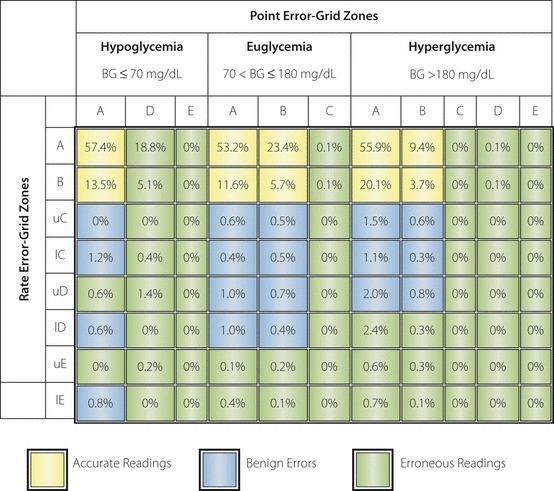
Figure 3.

The continuous glucose‐error grid analysis (CG‐EGA) computes the accuracy of the combination of rate‐error grid analysis (R‐EGA) plus point‐error grid analysis (P‐EGA) into three clinically relevant regions: hypoglycemia (blood glucose ≤70 mg/dL), euglycemia and hyperglycemia (blood glucose >180 mg/dL). BG, blood glucose; l, lower; u, upper.
