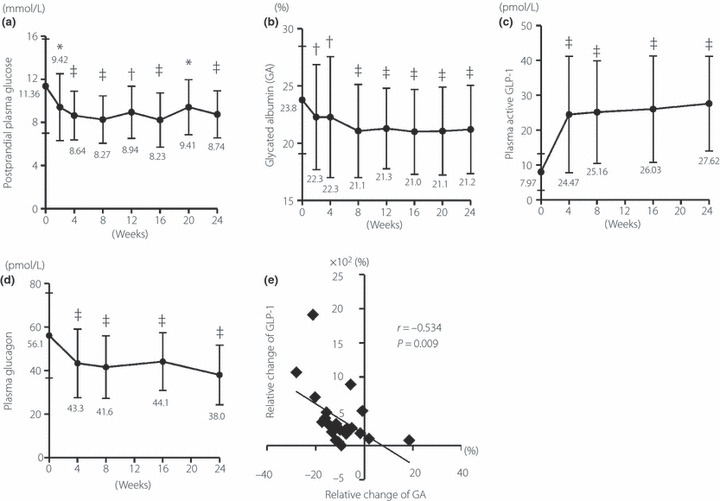
Figure 1.

Time‐course of changes in (a) postprandial plasma glucose, (b) glycated albumin, (c) plasma GLP‐1 and (d) plasma glucagon levels. *P < 0.05 vs week 0; †P < 0.01 vs week 0; ‡P < 0.001 vs week 0. (e) Correlation between relative changes in plasma active GLP‐1 and glycated albumin levels (n = 23).
