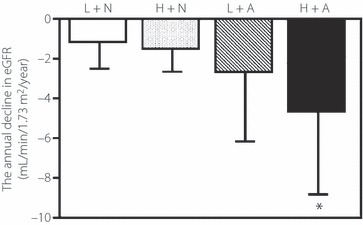
Figure 2.

Annual decline in estimated glomerular filtration rate (eGFR) during follow‐up. Patients were divided into four groups using the median value of urinary angiotensinogen level (24.7 μg/g Cr) and the presence of albuminuria (>30 mg/g Cr). Patients with low levels of urinary angiotensinogen and normoalbuminuria (L + N, n = 97); patients with high levels of urinary angiotensinogen and normoalbuminuria (H + N, n = 47); patients with low levels of urinary angiotensinogen and albuminuria (L + A, n = 21) and patients with high levels of urinary angiotensinogen and albuminuria (H + A, n = 69). The respective annual decline in eGFR was: −1.2 ± 1.3, −1.4 ± 1.3, −2.7 ± 3.5 and −4.6 ± 4.2 mL/min/1.73 m2/year. Data are mean ± SD. *P < 0.05 vs each other group (anova with Tukey–Kramer HSD test).
