
Figure 3.
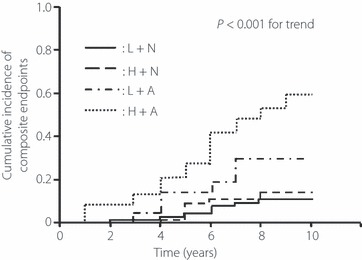
Kaplan–Meier curves for cumulative incidence of renal and cardiovascular composite endpoints. Patients were divided into the four groups using the median value of urinary angiotensinogen level (24.7 μg/g Cr) and the presence of albuminuria (>30 mg/g Cr). Patients with low levels of urinary angiotensinogen and normoalbuminuria (L + N, n = 97); patients with high levels of urinary angiotensinogen and normoalbuminuria (H + N, n = 47); patients with low levels of urinary angiotensinogen and albuminuria (L + A, n = 21) and patients with high levels of urinary angiotensinogen and albuminuria (H + A, n = 69). Difference among the groups was tested by log rank test.