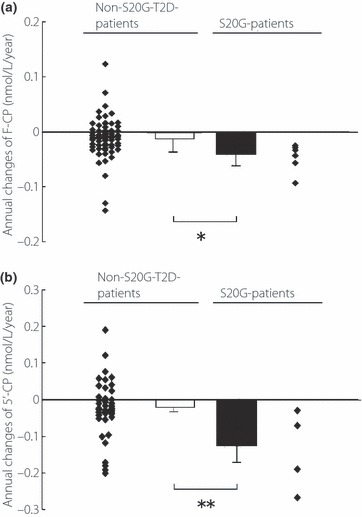
Figure 4.

(a) Annual changes of fasting serum C‐peptide level (F‐CP) in the type 2 diabetic patients without (non‐S20G‐T2D‐patients, n = 70) and those with the S20G mutation of the IAPP gene (S20G‐patients, n = 6). (b) Those who had 5‐min level of serum C‐peptide level after the intravenous injection of 1 mg glucagon (5′‐CP) in the 42 non‐S20G‐T2D‐patients and the four S20G‐patients. Individual values are shown as scatter plots and mean vales ± SD as columns, with statistical significance of the difference below columns. *P = 0.025, **P = 0.008 for the difference between the indicated groups. Individual annual decline was multiplied (−1) by the annual change.
