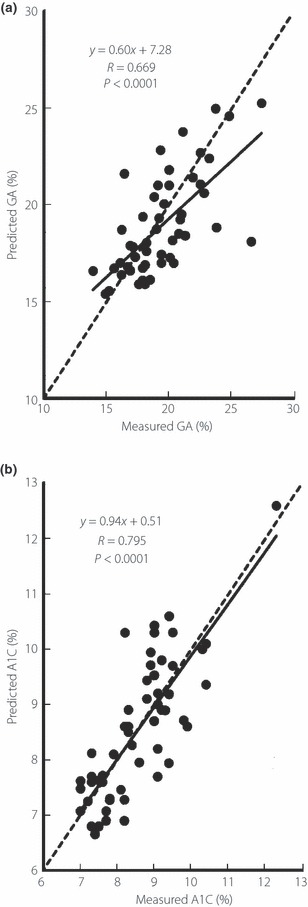
Figure 1.

Correlations between (a) predicted and measured glycated albumin (GA), and (b) predicted and measured glycated hemoglobin (A1C) at the third visit. Using the equations with GA and A1C before the start of treatment (first visit), and GA and A1C at the time of the second outpatient visit (second visit), the predicted GA and A1C values at the third visit were calculated, and their correlations with the measured GA and A1C values were investigated. The broken line corresponds to y = x.
