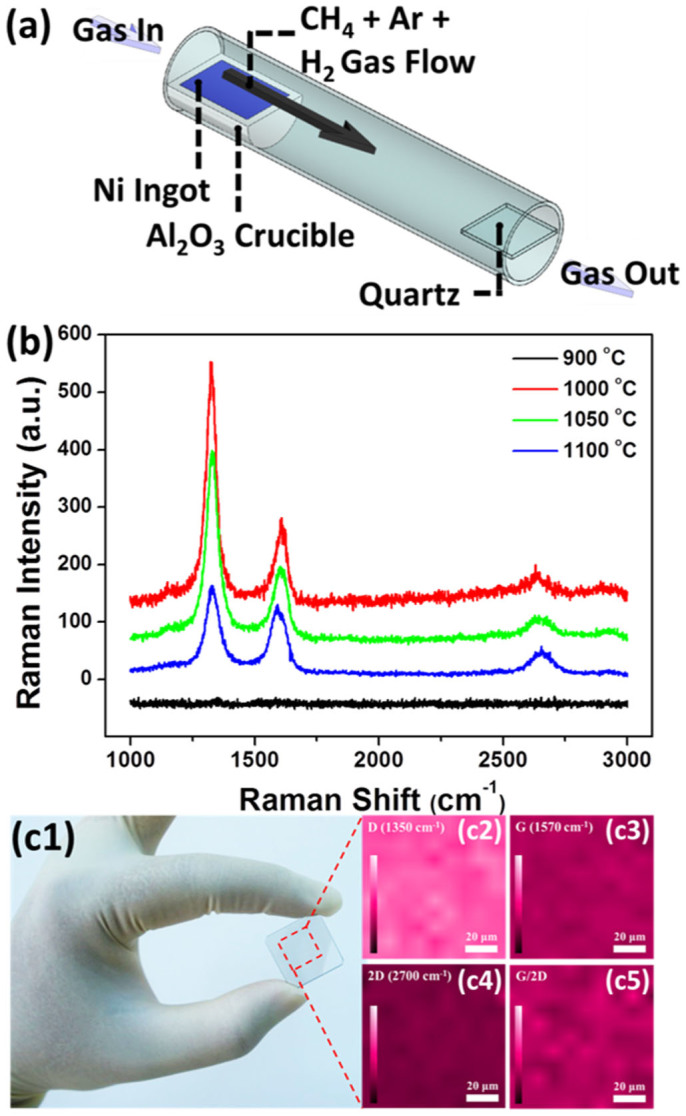
Figure 1.

(a) A schematic of graphene grown by Ni ingot-assisted approach in the CVD system. (b) Corresponding Raman spectra at different growth temperatures from 1000 to 1100°C for 5 minutes, with which D band at 1322 cm−1 G band at 1597 cm−1, and 2D band at 2645 cm−1 were measured. (c1) A optical image of the graphene deposited at 1000°C for 5 minutes. Insets (c2–c5) show Raman mapping images of D, G, 2D band, and G/2D ratios with scanned area of 100 μm2, respectively. Scale bars of c2 to c4 are ranged from 0 to 120 and the scale bar of c5 is ranged from 0 to 5.
