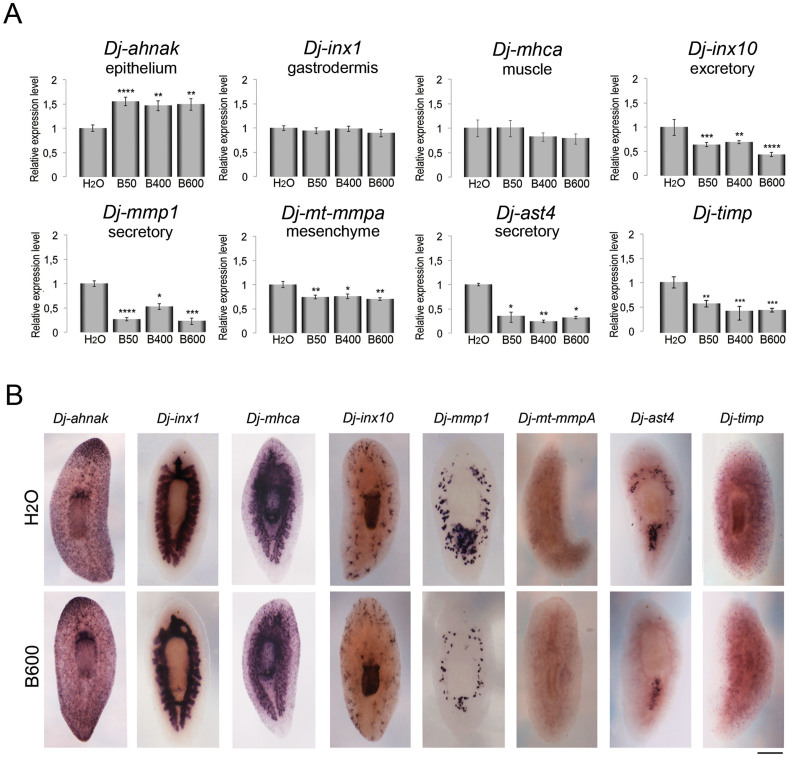
Figure 5. Effects of berberine on the transcriptional profile of representative markers of other differentiated cell types.
(A) Comparison of mRNA levels of representative markers expressed in different tissues: Dj-ahnak, Dj-inx1, Dj-mhca; Dj-inx10; Dj-mmp1; Dj-mt-mmpA, Dj-ast4 and Dj-timp in berberine-treated planarians and in controls. H2O: controls; B50: berberine 50 μM; B400: berberine 400 μM; B600: berberine 600 μM. In Real Time RT-PCR experiments, the expression levels are indicated in relative units, assuming as unitary the value of the controls. Each value is the mean ± s.d. of 3 independent experiments, carried out in 6 replicates. (B) Whole mount in situ hybridizations reveal the pattern of representative markers expressed in different tissues: Dj-ahnak, Dj-inx1, Dj-mhca, Dj-inx10; Dj-mmp1;Dj-mt-mmpA, Dj-ast4 and Dj-timp in 600 μM berberine-treated planarians (B600) and in controls (H2O). Scale bar: 400 μm.

