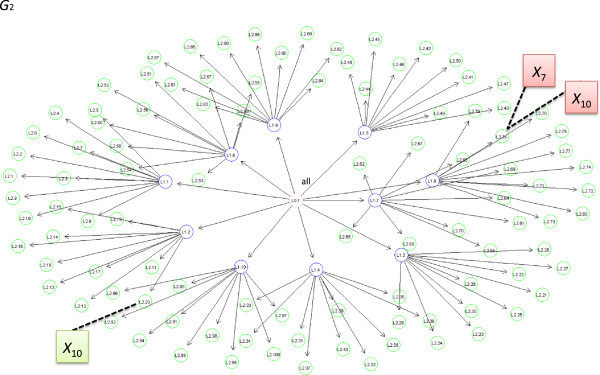
Figure 3.

Symmetric graph G2.G2 is a symmetric tree, with 100 leaves (green), 10 intermediate vertices (blue), and one root. The simulated genetic variants were distributed across the green nodes. The causal variants were first mapped to the same concept and then separated to distant concepts.
