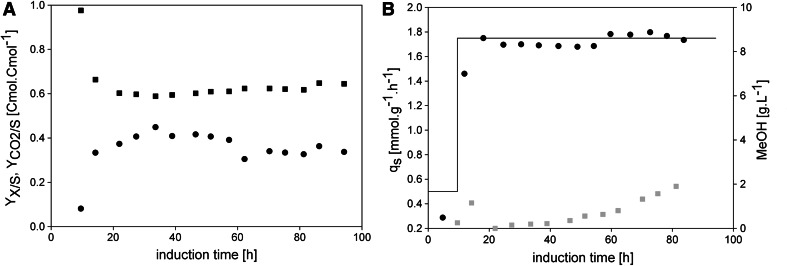
Fig. 2.
Cell physiology and methanol accumulation in FB1. a Biomass and carbon dioxide yields. Black dots, Y X/S; black squares, . b Specific substrate uptake rates and methanol concentration in the cell-free cultivation broth. Black solid line, q s setpoint; black dots, q s real; grey squares, methanol determined in the cell-free cultivation broth in g L−1

