
FIG. 4.
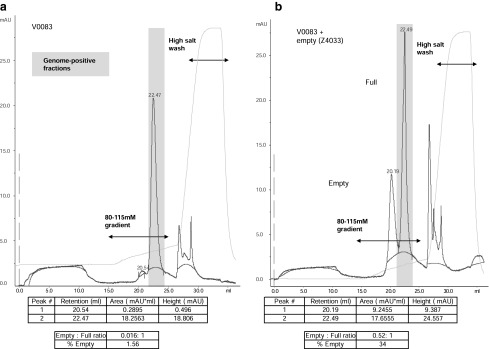
Quantification of relative empty-to-full particle content in a CsCl gradient-purified AAV8 vector preparation. (a) A full AAV8 vector preparation (lot no. V0083, 1×10¹² GC) was loaded onto a 0.34-ml CIM-QA disk and eluted with an 80–115 mM salt gradient. The y axis shows the absorbance (mAU) at 280 nm and the x axis the elution volume (ml). The detected conductivity and absorbance are represented by solid light and dark blue lines, respectively. Peak retention volumes are indicated by numbers on the dark blue trace on the chromatograph and in the table (bottom). Peak areas and heights in the table were determined by integration, using the Unicorn evaluation module; baselines calculated according to a morphological algorithm are shown as a red line. The peak areas were used to calculate the ratio of empty to full particles and percentage of empty particles. Fractions were quantified for vector GC content and those fractions containing >99% of the loaded material are indicated (shaded box). (b) A mixture of 75 μl of empty AAV8 particles (lot no. Z4033) and 1×10¹² GC of a full AAV8 vector preparation (lot no. V0083) was run under the same conditions and the peaks were evaluated identically.