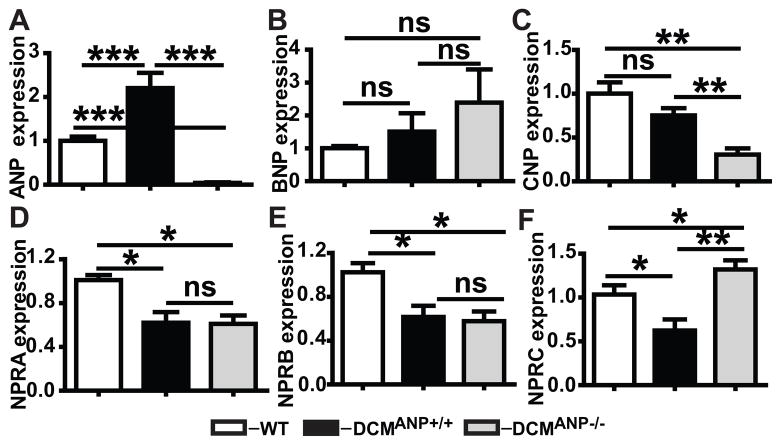
Figure 5. Changes in NPs and NP-receptors in WT, DCMANP+/+ and DCMANP−/− mice.
A–C. Relative cardiac expression of ANP, BNP and CNP. D–F. Relative cardiac expression of NPRA, NPRB and NPRC. Transcripts are means of averages of triplicate measures in 5 mice in each group assessed by qRT-PCR. ***p<0.001, **p<0.01, nsp>0.05.

