
Figure 2.
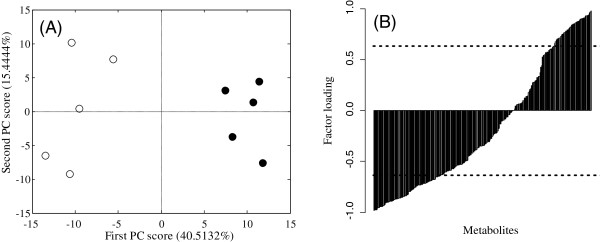
Results of PCA in a comparative study of normal and 12 h-fasted mice. (A) Scores plot of PC1 and PC2. Symbols: (○) control mice; (●) 12 h-fasted mice. (B) Factor loading plot for PC1. Metabolites are sorted in ascending order of the value for factor loading. The dotted line shows the significance level at p < 0.05.