
Figure 3.
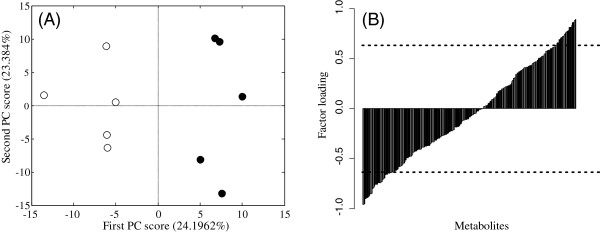
Results of PCA in a comparative study of db/db mice treated with and without pioglitazone. (A) Scores plot of PC1 and PC2. Symbols: (○) diabetic model mice (db/db mice) without pioglitazone; (●) db/db mice administered pioglitazone. (B) Factor loading plot for PC1. Metabolites are sorted in ascending order of the value for factor loading. The dotted line shows the significance level at p < 0.05.