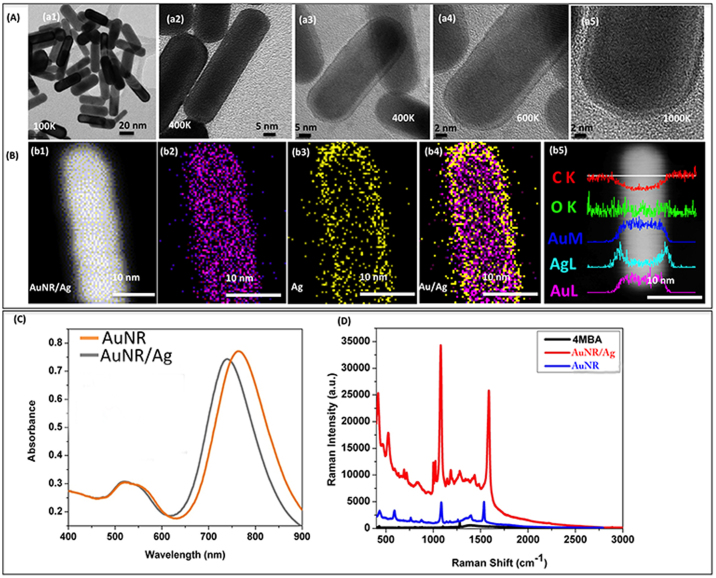
Figure 2.
(A): (a1–a2) High resolution transmission electron microscopy (HR-TEM) images of pure gold Nanorods (AuNRs); (a3–a5) HRTEM images of AuNR/Ag.(B)(b1–b4) STEM and EDS elemental mapping images for AuNR/Ag nanorods; (b5) EDS cross-scanning spectra for the AuNR/Ag nanorods. (C) Optical absorption spectra for AuNR and AuNR/Ag structures. (D) Raman scattering intensity for 4MBA (10 mM), and 4MBA deposited on AuNRs and AuNR/Ag (acquisition time 10 s).

