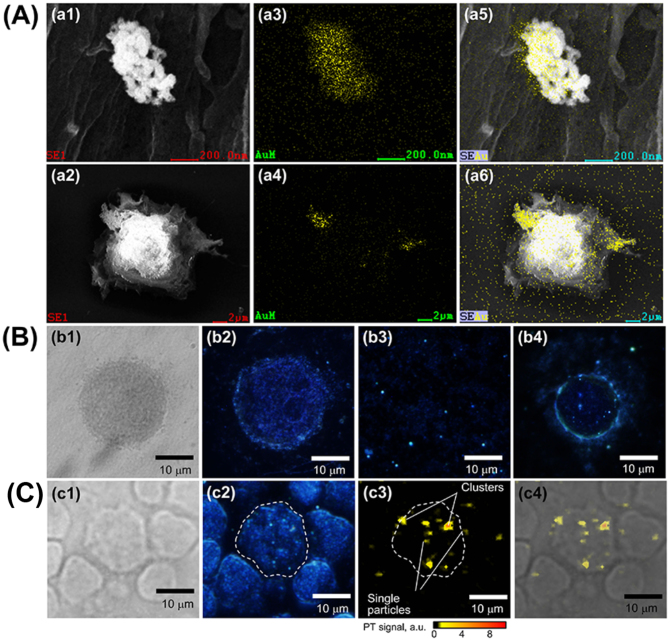
Figure 4.
Visualization of SERS nanoparticles on the cell membrane surface using: (A) SEM (a1, a2) with EDS Au elemental mapping (a3, a4) confirming AuNR/Ag clustering on the cell surface with the merged SEM and EDS mapping images (a5, a6). (B) Transmission (b1) and EDFM (b2) images of a control MCF-7 cell without SERS Nanorods; EDFM imaging of SERS Nanorods in solution (b3) and on MCF-7 cell membrane in PBS (b4). (C) Multimodal Transmission, EDFM, and PTM imaging of SERS labeled MCF-7 cells among WBCs from separated whole blood (c1),(c2),(c3); Merged PT and transmission microscopy images of the cells with the SERS nanorods on the celluar membranes (c4). PT microscopy parameters: 532 nm, 100 mJ/cm2.

