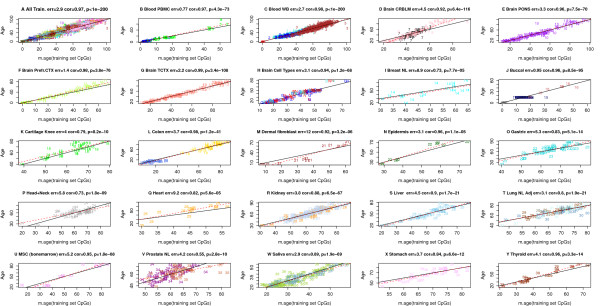
Figure 1.

Chronological age (y-axis) versus DNAm age (x-axis) in the training data. Each point corresponds to a DNA methylation sample (human subject). Points are colored and labeled according to the underlying data set as described in Additional file 1. (A) Across all training data, the correlation between DNAm age (x-axis) and chronological age (y-axis) is 0.97 and the error (median absolute difference) is 2.9 years. Results for (B) peripheral blood mononuclear cells (cor = 0.97, error <1 year), (C) whole blood (cor = 0.98, error = 2.7 years), (D) cerebellum (cor = 0.92, error = 4.5), (E) pons (cor = 0.96, error = 3.3), (F) pre-frontal cortex (cor = 0.98, 1.4), (G) temporal cortex (cor = 0.99, error = 2.2), (H) brain samples, composed of 58 glial cell, 58 neuron cell, 20 bulk, and 9 mixed samples (cor = 0.94, error = 3.1), (I) normal breast tissue (cor = 0.73, error = 8.9), (J) buccal cells (cor = 0.95, error <1 year), (K) cartilage (cor = 0.79, error = 4), (L) colon (cor = 0.98, error = 3.7), (M) dermal fibroblasts (cor = 0.92, error = 12), (N) epidermis (cor = 0.96, error = 3.1), (O) gastric tissue (cor = 0.83, error = 5.3), (P) normal adjacent tissue from head/neck cancers (cor = 0.73, error = 5.8), (Q) heart (cor = 0.82, error = 9.2), (R) kidney (cor = 0.88, error = 3.8), (S) liver (cor = 0.90, error = 4.5), (T) lung (cor = 0.80, error = 3.1), (U) mesenchymal stromal cells (cor = 0.95, error = 5.2), (V) prostate (cor = 0.55, error = 4.2), (W) saliva (cor = 0.89, error = 2.9), (X) stomach (cor = 0.84, error = 3.7), (Y) thyroid (cor = 0.96, error = 4.1).
