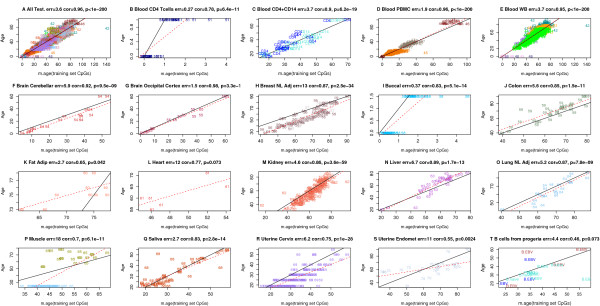
Figure 2.

Chronological age (y-axis) versus DNAm age (x-axis) in the test data. (A) Across all test data, the age correlation is 0.96 and the error is 3.6 years. Results for (B) CD4 T cells measured at birth (age zero) and at age 1 (cor = 0.78, error = 0.27 years), (C) CD4 T cells and CD14 monocytes (cor = 0.90, error = 3.7), (D) peripheral blood mononuclear cells (cor = 0.96, error = 1.9), (E) whole blood (cor = 0.95, error = 3.7), (F) cerebellar samples (cor = 0.92, error = 5.9), (G) occipital cortex (cor = 0.98, error = 1.5), (H) normal adjacent breast tissue (cor = 0.87, error = 13), (I) buccal epithelium (cor = 0.83, error = 0.37), (J) colon (cor = 0.85, error = 5.6), (K) fat adipose (cor = 0.65, error = 2.7), (L) heart (cor = 0.77, error = 12), (M) kidney (cor = 0.86, error = 4.6), (N) liver (cor = 0.89, error = 6.7), (O) lung (cor = 0.87, error = 5.2), (P) muscle (cor = 0.70, error = 18), (Q) saliva (cor = 0.83, error = 2.7), (R) uterine cervix (cor = 0.75, error = 6.2), (S) uterine endometrium (cor = 0.55, 11), (T) various blood samples composed of 10 Epstein Barr Virus transformed B cell, three naive B cell, and three peripheral blood mononuclear cell samples (cor = 0.46, error = 4.4). Samples are colored by disease status: brown for Werner progeroid syndrome, blue for Hutchinson-Gilford progeria, and turquoise for healthy control subjects.
