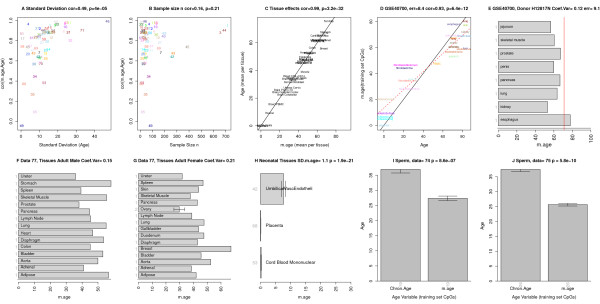
Figure 3.

Factors affecting the relation between age and DNAm age. (A-C) Factors influencing prediction accuracy in the training and test sets. (A) The standard deviation of age (x-axis) has a strong relationship (cor = 0.49, P = 4E-5) with age correlation (y-axis). To arrive at an unbiased measure of prediction accuracy, I estimated the age correlation using a leave-one-data-set-out cross validation (LOOCV) analysis. Each point is labeled and colored according to the underlying data set (Additional file 1). (B) Sample size (x-axis) is not significantly correlated with the age correlation (y-axis). (C) Mean DNAm age per tissue (x-axis) versus mean chronological age (y-axis). Points correspond to the human tissue data mentioned in Additional file 1. Breast tissue shows signs of accelerated aging. (D,E) The effect of tissue type on the age prediction in test data set 71 even for tissues that were not part of the training data (for example, esophagus, jejunum, penis). (E) The horizontal bars report the DNAm age (x-axis) of a single tissue from a single donor (H12817). Only one sample per tissue (grey axis numbers) was available. DNAm age has a low coefficient of variation (0.12). The red vertical line corresponds to the true chronological age. (F-H) DNAm age for various tissues from data set 77 but chronological age was not available. (F,G) A multi-tissue analysis of somatic adult tissue data from an adult male and an adult female, respectively. (H) Neonatal tissues tend to have low DNAm age. (I,J) The DNAm age of sperm is significantly lower than the chronological age of the respective sperm donors in data sets 74 and 75, respectively. Error bars represent one standard error.
