Figure 5.

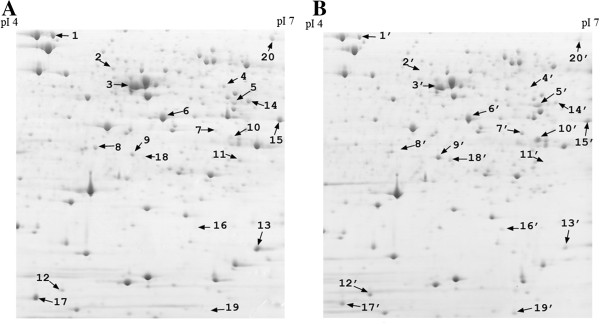
Representative 2-DE maps showing the protein profiles of TX01 and TXhfq. Whole cell proteins prepared from TX01 (A) and TXhfq (B) were subjected to 2-DE analysis. Numbers indicate protein spots with differential expression.

Representative 2-DE maps showing the protein profiles of TX01 and TXhfq. Whole cell proteins prepared from TX01 (A) and TXhfq (B) were subjected to 2-DE analysis. Numbers indicate protein spots with differential expression.