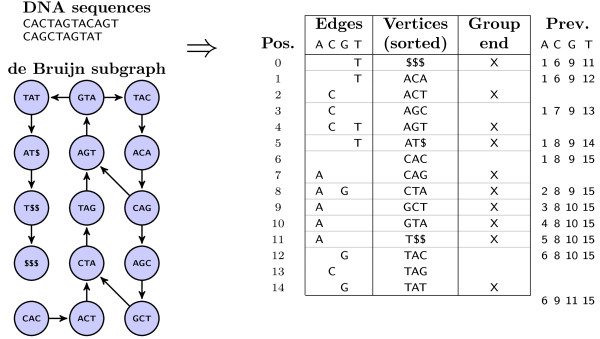
Figure 1.

The kFM-index data and corresponding de Bruijn subgraph. Representation of the data structure for DNA 4-mers. The vertex strings, lexigographically sorted, are not stored, but reconstructed from the edge and group end data. The edges columns indicate in-coming edges to each vertex, i.e. letters that may prefix the vertex strings. The group end flag inidicates groups of vertices with the same k−2-prefix. The previous position data can be generated from the edge set data and group end data and is constant within each vertex group; a subset is stored for computational speed.
