
Figure 1.
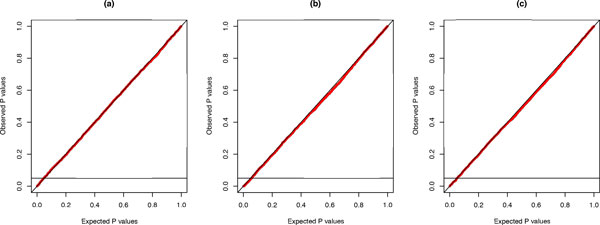
PP-plot for the three tests with respect to . The observed P-values were calculated from 5000 Monte Carlo experiments for each test (i.e., the Index test (a), the Markov chain test (b), and the likelihood-ratio test (c)) and charted against the expected P-values.