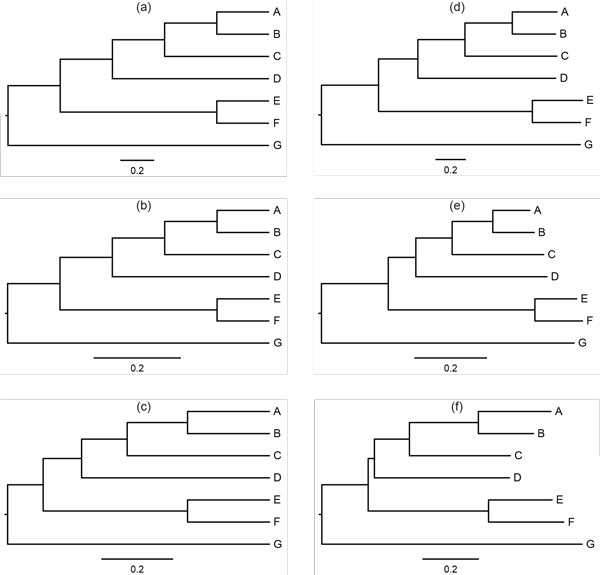
Figure 5.
Effect of recoding on phylogenetic estimates. Panel (a) displays the tree that was used to generate alignments of 3000 nucleotides under a time-reversible 4-state Markov model. Panel (b) shows the corresponding tree with edge lengths adjusted according to the RY-recoding scheme. Panel (c) shows the corresponding tree with edge lengths adjusted according to the KM-recoding scheme. Panels (d), (e), and (f) present the corresponding results obtained by analysis of the data generated on the tree in panel (a). The scale bar corresponds to the expected number of substitutions .

