
Figure 6.
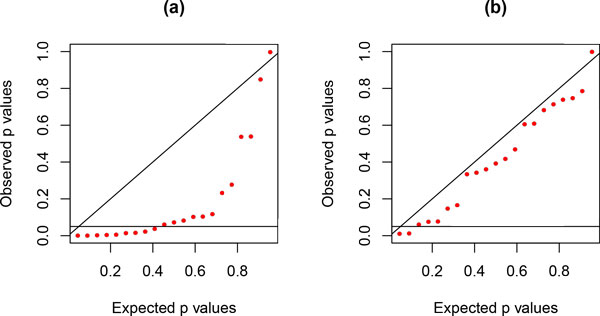
PP-plots for lumpability tests for hominoid mitochondrial data. PP-plots for the likelihood-ratio tests for lumpability for hominoid data for RY-recoding (a) and for AGY-recoding (b), respectively.
Official websites use .gov
A
.gov website belongs to an official
government organization in the United States.
Secure .gov websites use HTTPS
A lock (
) or https:// means you've safely
connected to the .gov website. Share sensitive
information only on official, secure websites.
PP-plots for lumpability tests for hominoid mitochondrial data. PP-plots for the likelihood-ratio tests for lumpability for hominoid data for RY-recoding (a) and for AGY-recoding (b), respectively.