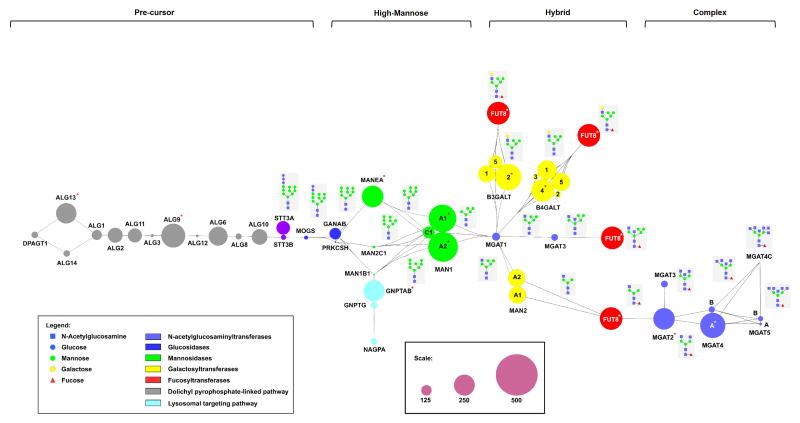
Figure 1. MiRNA regulatory map for glycogenes in the N-linked glycosylation pathway.
A schematic illustration of the N-linked glycan pathway with the relevant glycosylation enzymes is shown. Synthetic pathways for Glc2Man9GlcNAc2-dolichol precursor, high-mannose, hybrid and complex oligosaccharides are indicated. The multicomponent oligosaccharyltransferase (OST) is represented by STT3A and STT3B (purple), the genes that encode for the catalytic subunits. The size of the circles (nodes) represents the total number of miRNA binding sites (both conserved and non-conserved) predicted within the 3′UTR of the indicated glycogenes (see Methods for details, scale shown in inset). Color of circle corresponds to the enzyme class (see inset legend). Where multiple isoforms of the same glycogene exist, the isoform is indicated within the circle). Linkages between the nodes illustrate the various paths of the biosynthetic pathway and the resulting glycan structures are shown in the grey boxes. “Highly regulated” glycogenes are denoted with an asterisk (*).

