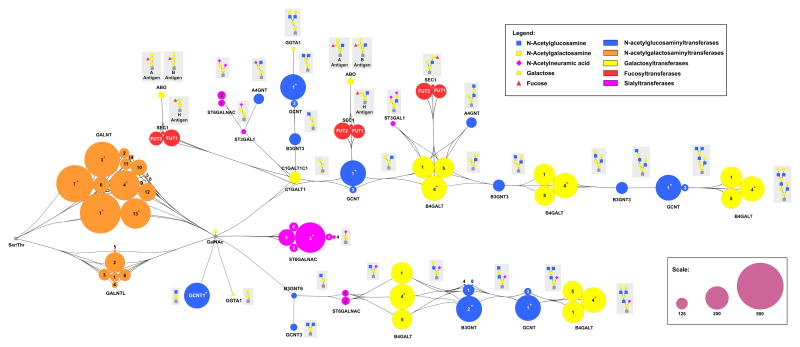
Figure 2. MiRNA regulatory map for glycogenes in the O-linked glycosylation pathway.
A schematic illustration of the O-linked glycan pathway with the relevant glycosylation enzymes is shown. Pathway is annotated as in Figure 1. “Highly regulated” glycogenes are denoted with an asterisk (*).

