
Figure 2.
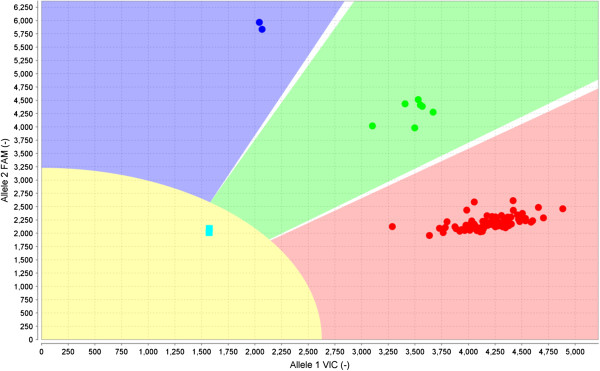
View of mutation assay p.M34T using the OpenArray™ plate and TaqMan® Genotyper software. The red cluster represents samples with the normal sequence for both alleles. The green cluster includes individuals having one normal allele and one mutant allele (heterozygous). The blue cluster represents homozygous mutants containing both copies of the mutant alleles. The yellow region with the two blue squares corresponds to the fluorescence of the controls (NTC).