. 2014 Mar 4;109(2):154–162. doi: 10.1590/0074-0276140275

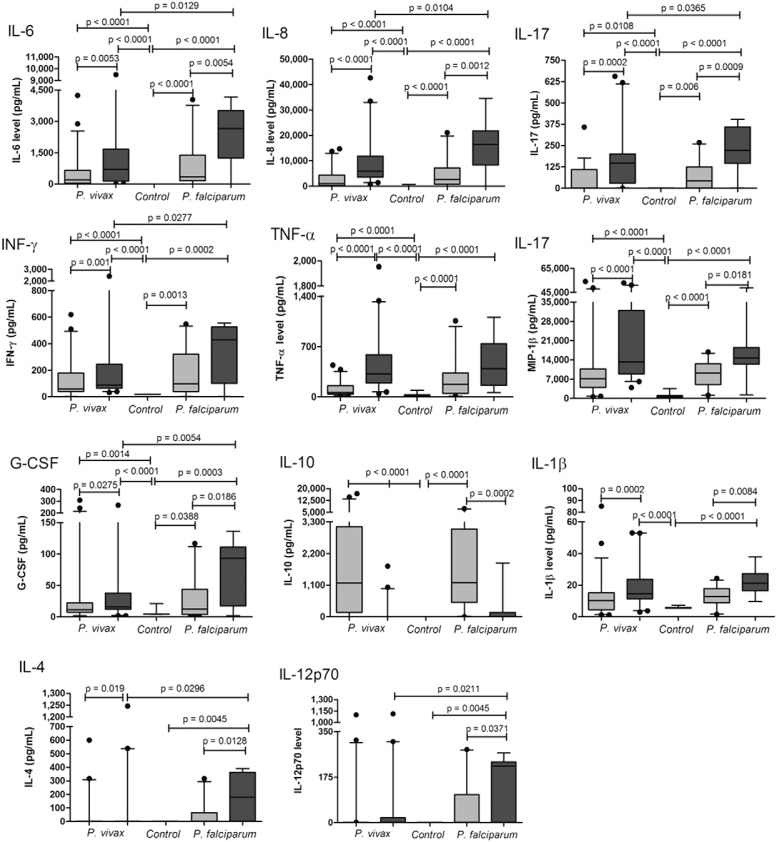
Fig. 1. : comparison of serum cytokines and chemokines levels between control, Plasmodium vivax and Plasmodium falciparum patients in acute and convalescent phase of infection. The control group was indicated by white bars, while acute and convalescent phase of infection were indicated by light and dark gray bars, respectively. The boxes represent the values between 25-75% quartile and the line indicates the median. The whiskers indicate the 5% and 95% percentiles. Comparison between control group and patients infected by P. vivax and infected by P. falciparum were evaluated by compared by Bonferroni’s multiple comparison test. When the test indicated a significant difference (p < 0.05) between groups pairwise, Mann-Whitney U test were used. To assess the significant differences between acute and convalescent phase in P. vivax and P. falciparum infected-patients non parametric paired t tests were used. The significant differences and the respective p values were indicated on figure. G-CSF: granulocyte-colony stimulating factor; IFN: interferon; IL: interleukin; MIP: macrophage inflammatory protein; TNF: tumour necrosis factor.

Fig. 1