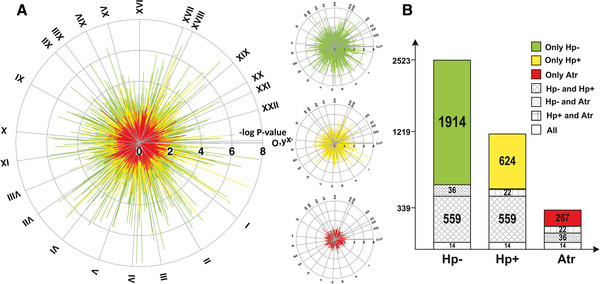
Figure 1.

Differences in global gene expression between antrum and corpus samples in different patient groups. A. The negative logarithms of p-values for the difference in expression between antrum and corpus tissues are shown as the length of each spike in the circle diagrams (i.e. 8 equals p = 10-8), Hp- (green), Hp + (yellow) and Atr (red). All genes in the microarray are shown; the chromosomal location of each gene is indicated by the circle sections in clock-wise direction (chromosome I to XXII). B. The number of differentially expressed genes in antrum compared to corpus tissue in Hp-, Hp + and Atr groups, respectively. The sections, and their corresponding numbers, indicate the number of genes significantly different between antrum and corpus in only one patient group (colored sections), or genes for which a difference between antrum and corpus was found in two or three patient groups (patterned sections). The cut-off for inclusion in the figure was a p-value < 0.05 for the comparison between antrum and corpus in each patient group.
