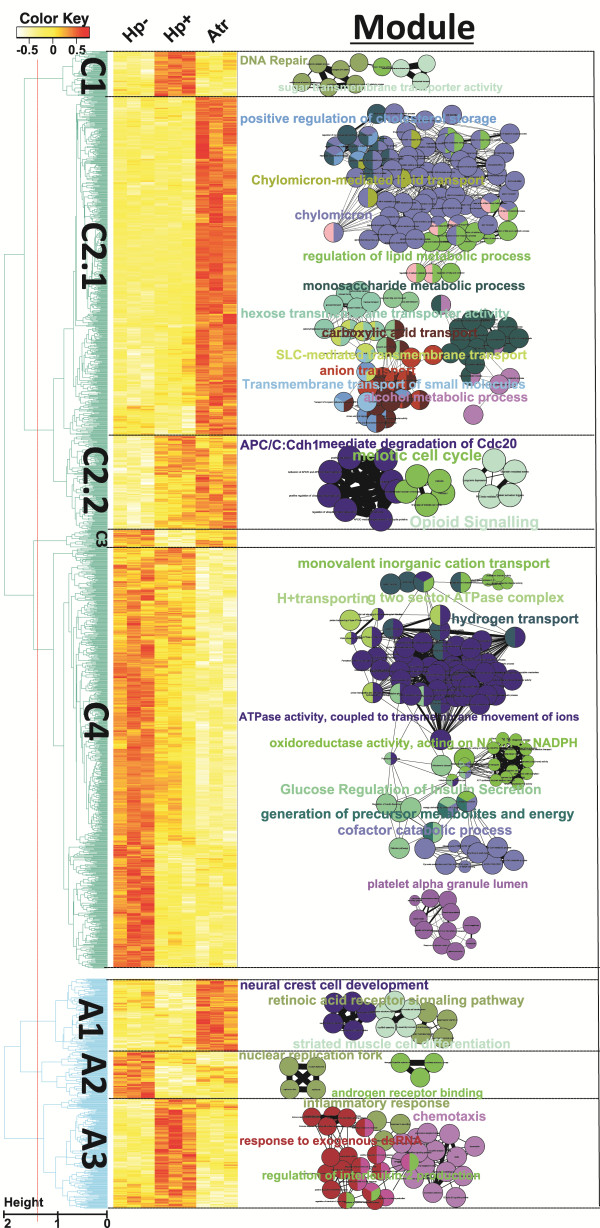
Figure 3.
Hierarchical clustering analysis of corpus and antrum gene expression along the patient groups. Genes with differential expression across the patient groups (p < 0.001, one-way ANOVA) were clustered. The relative expressions of all clustered genes are shown in heat-map form, where white color indicates down-regulated expression, and red color indicates up-regulated expression. The significantly enriched ontologies are shown in association to each cluster (bubbles). Related ontologies are depicted by the same color, and are connected by lines. The names of the most highly significant ontologies are shown in a large font size. For enlargement of all ontology names, see Additional file 1: Figure S3.

