
Figure 4.
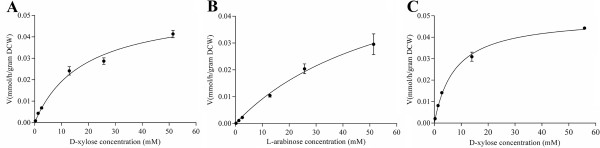
Kinetics of xylose transporter-1 (XAT-1) for D-xylose (A) and L-arabinose (B) and the kinetics of XYL-1 for D-xylose (C). The rate of sugar transport was determined as a function of sugar concentration. The transport rate was normalized for yeast dry cell weight (DCW). The background values determined with cells containing the empty vector were subtracted. Error bar indicates the standard deviation of the triplicates.