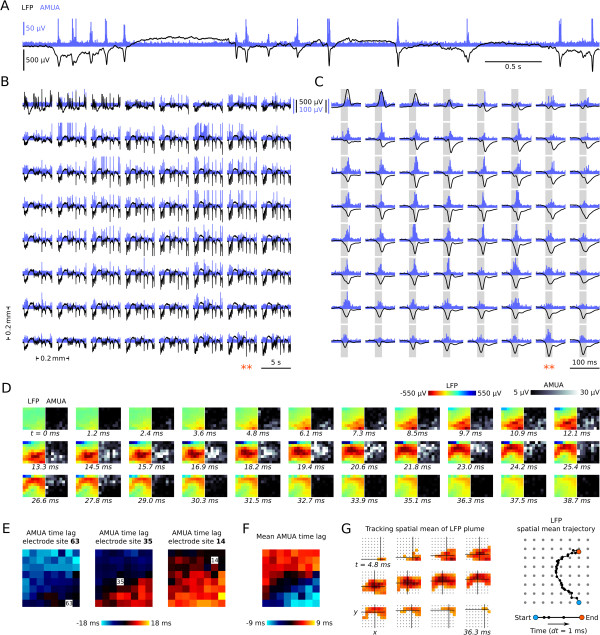
Figure 2.
Propagating slow-waves in the zebra finch forebrain. (A) This is an expanded five-second recording showing the temporal pattern of local field potential (LFP) and analogue multiunit activity (AMUA) (Bird 6, horizontal plane, and electrode site column 6, row 4 from Figure 2B). (B) The same five-second example as in Figure 2A as recorded across the 8 × 8 grid of electrode sites, showing that oscillations appear to be globally distributed. (C) Detail of the LFP and AMUA peak indicated with two asterisks in Figure 2B, showing that peak activity occurs at slightly different times in different sites. (D) This is the same peak event as in Figure 2C, now visualized in a sequence of image plots, where each image has 8 × 8 pixels corresponding to the 8 × 8 grid of electrode sites, and where pixel color and gray levels correspond to LFP and AMUA magnitudes. The peak of the waveform plots in Figure 2C now appears as a propagating plume of activity. (E) The AMUA time lag of peak activity for three sites, each relative to the other sites, expressed in an 8 × 8 matrix of image pixels that correspond to the site positions in the electrode grid. Time lags are calculated as the lag of maximum cross-correlation, with cross-correlation lags ranging from −50 to +50 ms. See text for more explanation. (F) The mean lag of an electrode site relative to the other sites (mean of n = 63). Each pixel is the mean of the values as shown in an 8 × 8 matrix in Figure 2E. (G) LFP plume propagation across the grid is tracked by calculating the spatial average of the plume in 1-ms intervals, based on sites with a potential < −0.25 mV. Cross hairs indicate plume spatial average for a selection of 12 1-ms time intervals.

