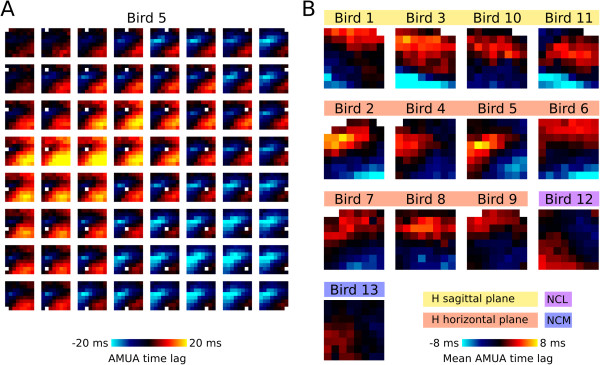
Figure 4.

Directional structure in action potential propagation. Time lags of maximum between-electrode site cross-correlation of analogue multiunit activity (AMUA) signals show that despite the diversity of patterns in action potential activity propagation visible in the recording videos, there is directional structure in action potential plume propagation patterns. (A) This is an example of mean between-electrode time lags in the recording of Bird 5 (horizontal recording in the hyperpallium, H). Means are calculated over identified plumes (n = 712 plumes in Bird 5). Each subplot in the 8 × 8 matrix of image plots corresponds to an electrode site with the matrix arrangement of subplots corresponding to the locations of electrodes on the multi-electrode probe; cf. Figure 1A. Subplots are images in which the color of pixels represents the lag in milliseconds of the maximum cross-correlation between that particular site and each of the 63 other electrode sites (see Figure 2E and main text). (B) For every bird, the mean time lag of each electrode site with all other sites is shown (cf. Figure 2F).
