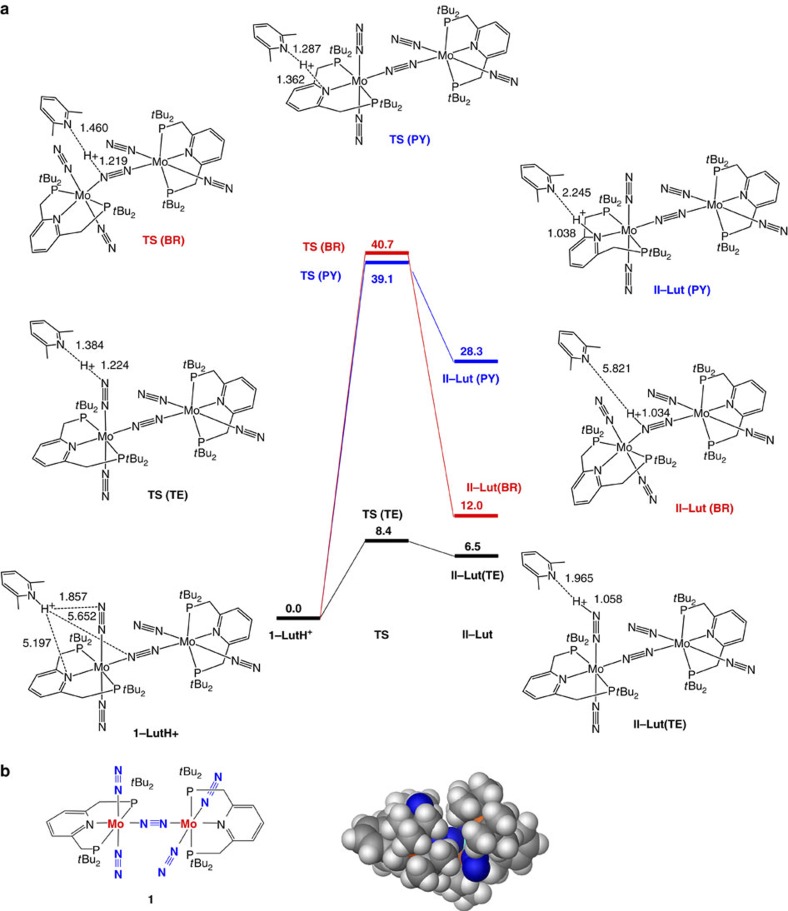
Figure 3. The first protonation step of 1.
(a) Energy profiles for proton transfer from LutH+ to a terminal dinitrogen ligand (TE, black), the bridging dinitrogen ligand (BR, red) and the pyridine nitrogen atom in the pincer ligand (PY, blue) in 1. Relative energies are given in kcal mol−1. (b) A space-filling model of 1.

