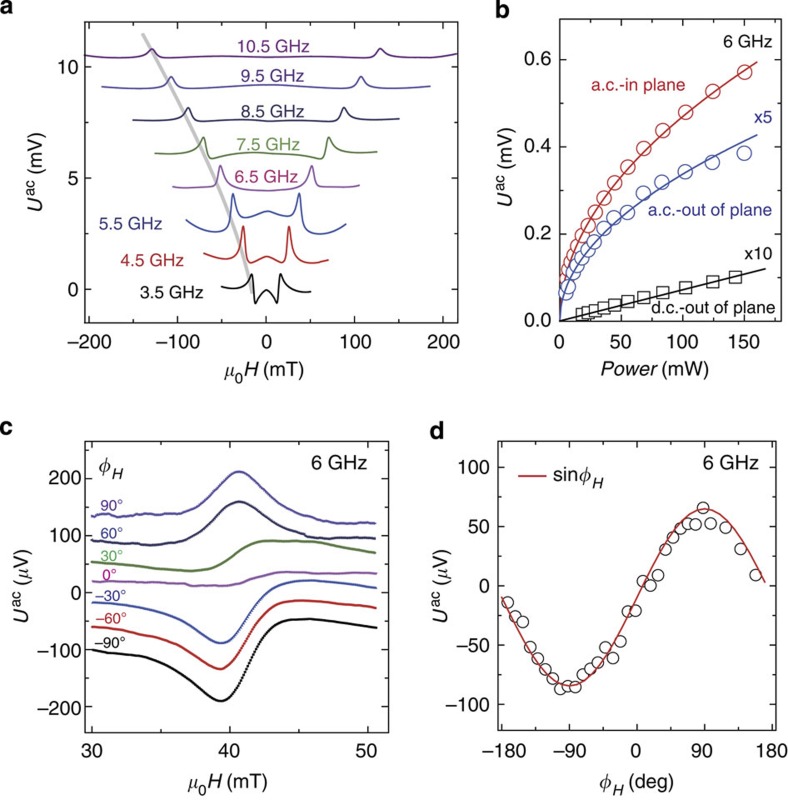
Figure 3. The frequency, power and angular dependence of the a.c.-ISHE signals.
(a) The a.c.-ISHE voltages measured by a lock-in amplifier at microwave frequencies from 3.5 to 10.5 GHz using in-plane excitation. (b) The microwave power (P) dependence of  (in-plane and out-of-plane excitation) and
  (out-of-plane excitation) at 6 GHz, for comparison the a.c.- and d.c.- signals measured with out-of-plane excitation are multiplied by 5 and 10, respectively. The solid lines are fits to
  and P for a.c.- and d.c.-ISHE, respectively. (c) a.c.-ISHE measured at 6 GHz using out-of-plane excitation with different field angles φH from −90° to 90°. (d) Angular dependence of the amplitude of
  . Note that for in-plane excitation one finds an even symmetry of the a.c.-ISHE signal with respect to the direction of the applied field (a), while for out-of-plane excitation one finds an odd symmetry (c). This behaviour is expected from the symmetry of the susceptibility.

