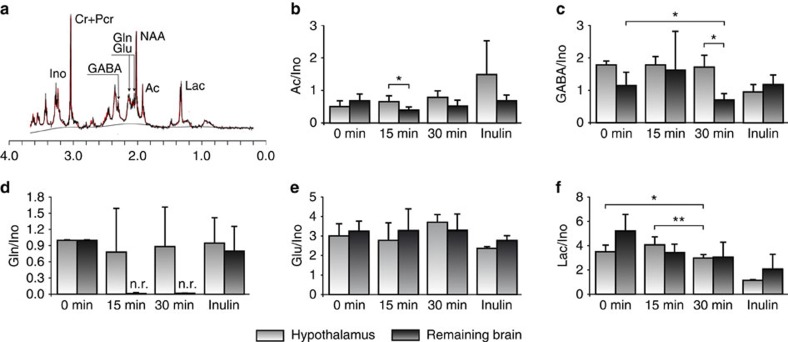
Figure 5. Relative changes in total metabolite content in the hypothalamus and remaining brain biopsies after (2-13C) acetate or (U-13C) inulin administrations.
(a) 1HR-MAS spectrum from a representative biopsy from the hypothalamus (black) and superimposed LCModel fitting (red). (b–f) Relative 1H HR-MAS ratios Ac/Ino, GABA/Ino, Glu/Ino, Gln/Ino and Lac/Ino at increasing times after (2-13C) acetate or (U-13C) inulin administrations. Lac, lactate; Ac, acetate;, Glu, glutamate; Gln, glutamine; GABA, γ-amino butyric acid; Cr+PCr, creatine+phosphocreatine; Ino, myo-inositol; n.r, not resolved; CRLB, Cranmer–Rao Lower Bound <20%. Bar graphs represent the mean and standard deviation. Statistical significance was evaluated using two-tailed unpaired Student t-test. “Remaining brain” accounts for cerebral extra-hypothalamic tissue. *P<0.05, **P<0.01.

