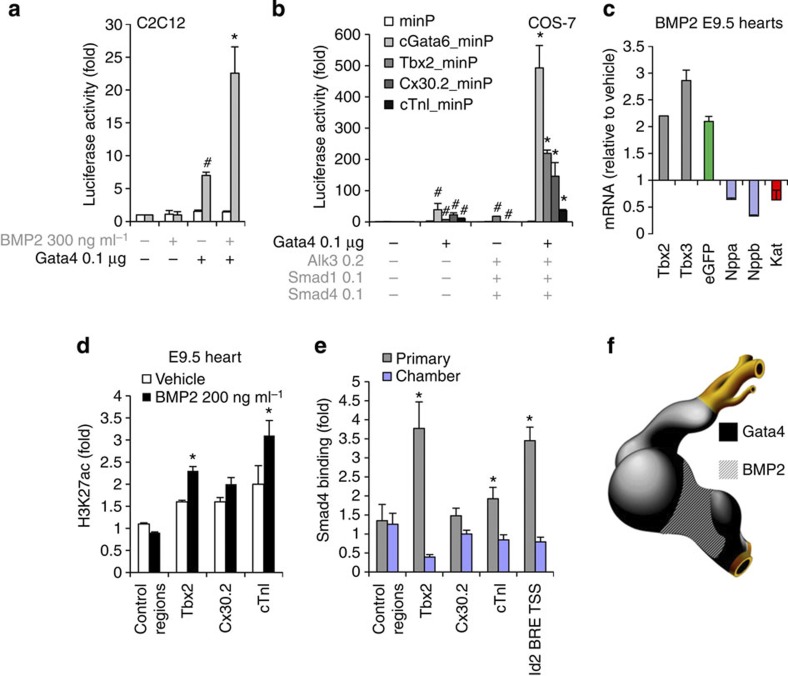
Figure 3. The Gata4-Smad-Hat complex induces H3K27 acetylation and AV canal gene activation.
(a) Luciferase reporter assays on the 102 bp cGata6 enhancer. Plasmids encoding full-length Gata4 protein, the luciferase reporter construct with a minimal promoter (minP) or containing the cGata6 enhancer with the same minimal promoter (cGata6_minP) were co-transfected in C2C12 cells. The cells were incubated with or without the recombinant human BMP2. Statistical test was conducted using two- and three-way analysis of variance (ANOVA) (mean±s.e.m., n=3, #P<0.05 for Gata4 or BMP2 treatment versus control, *P<0.05 for Gata4 and BMP2 treatment versus Gata4 or BMP2 treatment). (b) Luciferase reporter assays on the 102 bp cGata6, the 380 bp Tbx2, 660 bp Cx30.2 and the 356 bp cTnI genomic fragments. Constructs were co-transfected with Gata4, Alk3CA, Smad1 and Smad4 expression vectors into Cos-7 cells. Luciferase activity was determined and normalized as fold over the reporter alone (mean±s.e.m., n=6, #P<0.05 for Gata4 or BMP2 effectors versus control, *P<0.05 for Gata4 and BMP2 effectors versus Gata4 or BMP2 effectors, using two- and three-way ANOVA). (c) E9.5 chambers–Katushka/AV canal-EGFP transgenic hearts were cultured in the presence or absence of 200 ng ml−1 Bmp2 for 48 h, and expression of AV canal (Tbx2, Tbx3, EGFP) and chamber markers (Nppa, Nppb, Kat) was analysed with real time RT–PCR. Data were normalized to HPRT and expressed as folds of increase over untreated samples. (d) Untreated and Bmp2-treated E9.5 hearts were subjected to ChIP assay analyses with anti-H3K27ac antibody. Histograms represent enrichment for Tbx2, Cx30.2 and cTnI regulatory enhancers (mean±s.e.m., n=3, *P<0.05 using the Student’s two-tailed t-test). (e) ChIP–qPCR analysis with Smad4 antibody on E10.5 embryo extracts from AV canal/outflow tract and chamber myocardium. Primers amplifying the BRE of the Id2 promoter serve as a positive ChIP control27. Pulled-down DNA fragments were analysed with real-time PCR and enrichment indicates the ratio of ChIPed DNA to negative control regions, normalized for input DNA (mean±s.e.m., n=3, *P<0.05 using the Student’s two-tailed t-test). (f) Cartoon depicting the overlapping expression patterns of Bmp2/Smad4 and Gata4 at stage E9.5–E10.5.

