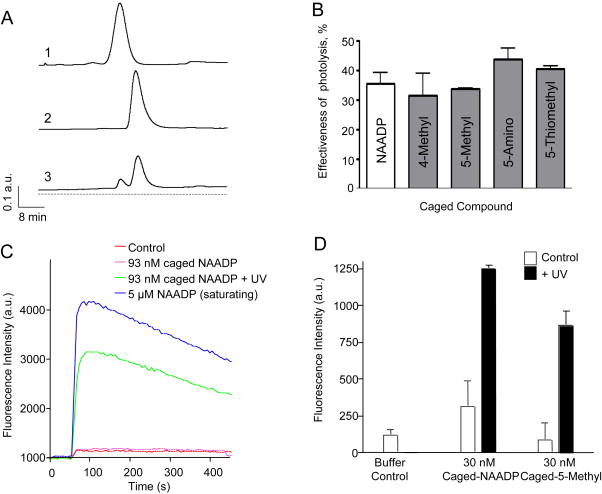
Figure 2.

UV photolysis of caged NAADP analogs (1–5). (A) HPLC traces of 50 μl samples of 685 μM (1) NAADP, (2) caged NAADP before photolysis reaction, and (3) caged NAADP after photolysis reaction resulting in the appearance of a liberated NAADP peak. (B) Photolysis efficiency of different caged NAADP analogs. Data shows the portion of uncaged compound of each analog expressed as percent of total compound after 10 min photolysis reaction; mean data of three experiments. (C) Fluorometric Ca2+ release traces from Fluo-3 labeled sea urchin Strongylocentrotus purpuratus egg homogenates after addition of 5 μM NAADP, 93 nM caged NAADP, or 93 nM caged NAADP treated with UV light prior to addition (D) Peak fluorescence intensity following addition as in (C) of caged NAADP or caged 5-methyl-NAADP directly (Control) and with prior UV treatment (+UV).
