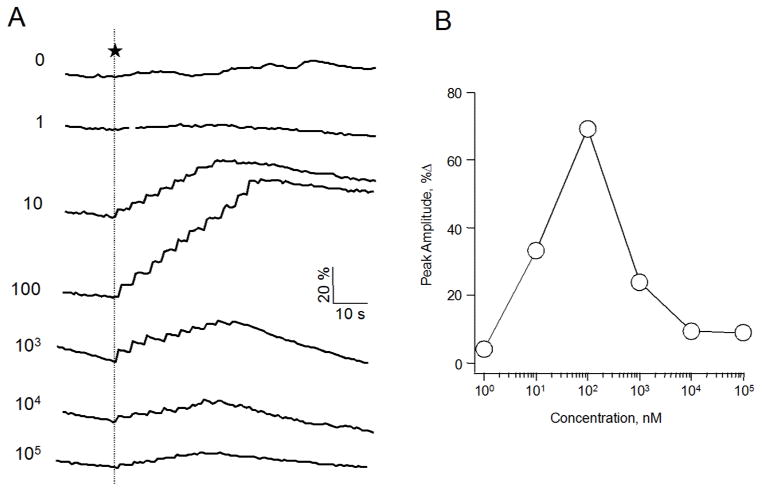
Figure 3.
NAADP-mediated Ca2+ signaling in SKBR3 cells. (A) Representative fluorometric traces of Ca2+ release in single SKBR3 cells induced by the photolysis of caged NAADP. Cells were co-injected with a mixture of the indicated concentration in nM of caged NAADP and the Ca2+ sensitive dye Fluo-4 (200 μM). Free cytosolic Ca2+ was measured after applying 8–10 flashes of UV light to release active NAADP (indicated by dotted line). (B) The % increase from baseline of the peak amplitude of each trace presented in A.

