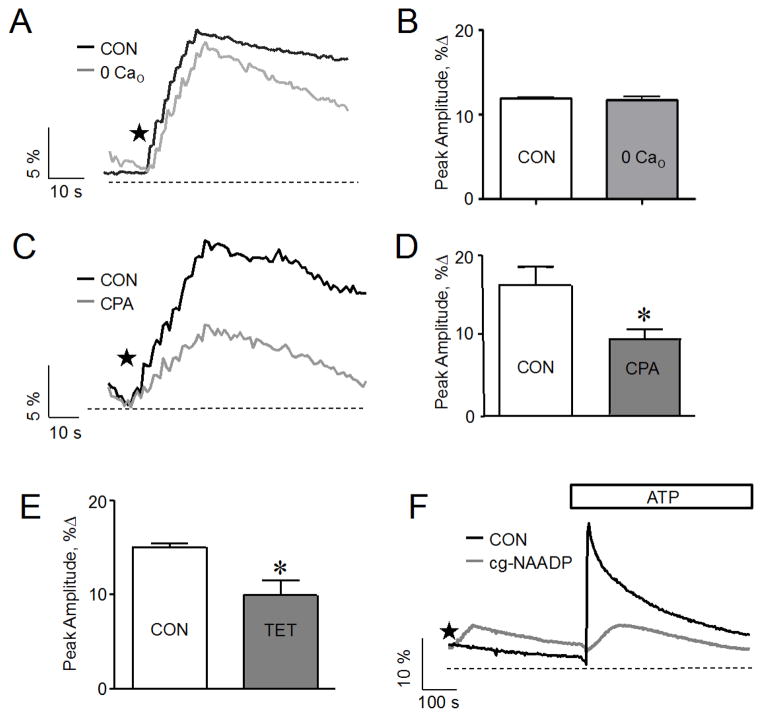
Figure 4.
Effect of a reduction in extracellular or ER Ca2+ on Ca2+ signals evoked by the photolysis of caged NAADP in SKBR3 cells. (A) Ca2+ release response to the photolysis of caged NAADP (100 nM) in Ca2+ free medium (0 Cao) and control medium (CON). (B) The cumulative data from (A) plotted as % increase of the Ca2+ peak relative to baseline; mean data of 3–5 experiments; p > .05. (C) Reduction of Ca2+ signals induced by the photolysis of caged NAADP (100 nM) following pretreatment with CPA (1 μM) for 30–40 minutes compared to control (CON). (D) The cumulative data from (C) plotted as % increase of the Ca2+ peak relative to baseline; mean data of 3–5 experiments; *, p < .05. (E) Decrease in Ca2+ signals induced by the photolysis of caged NAADP (100 nM) following pretreatment with tetracaine (100 μM) for 20 minutes compared to control (CON); data plotted as % increase of the Ca2+ peak relative to baseline; mean data of 3–5 experiments; *, p < .05. (F) Ca2+ response to ATP application without (black line) or following (gray line) photolysis of caged NAADP (100 nM). The amount of Ca2+ released by extracellular ATP (100 μM) from the ER is lowered if the response to photoreleased NAADP occurred prior to ATP addition. Stars indicate application of sequential flash uncagings.

