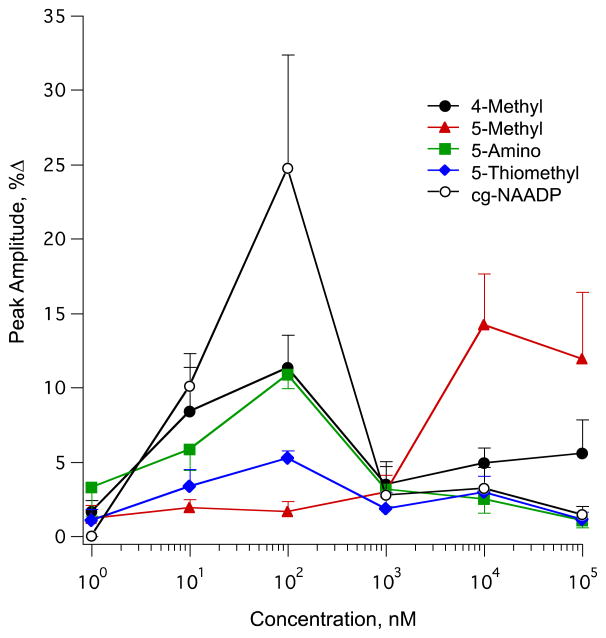
Figure 8.
Concentration–response curves for photolysed NAADP analogs (1–5) in SKBR3 cells. Curves depict the average peak of Ca2+ concentration attained from SKBR3 cells following photolysis of (1) NAADP, (2) 4-methyl NAADP, (3) 5-methyl NAADP, (4) 5-amino NAADP, and (5) 5-thiomethyl NAADP. Each plotted point represents the mean of a minimum of three experiments.

