Figure 3.

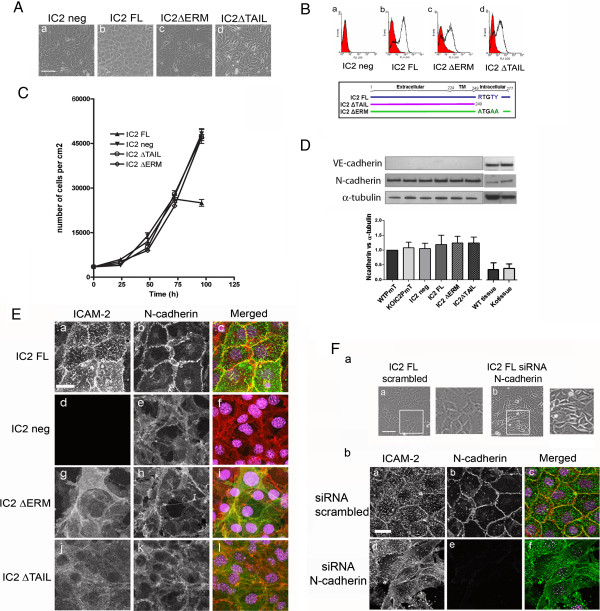
ICAM-2 regulate N-Cad localization at cell-cell junction. A- Generation of mouse cardiac EC (MCEC) cell lines. Phase contrast image of IC2 neg (a), IC2FL (b), IC2 ΔERM (c) and IC2 ΔTAIL (d) cells. Bar = 150 μm. B- Analysis of ICAM-2 surface protein expression by FACS in IC2 neg (a), IC2 FL (b), IC2 ΔERM (c), IC2 ΔTAIL (d) cells; below, diagram showing the WT and mutant sequences of the constructs. FACS staining was performed using mAb 3C4 anti-mouse ICAM-2. C- Growth curves of MCEC cell lines. IC2 neg, IC2 ΔERM and IC2 ΔTAIL cells show loss of contact inhibition of cell growth. Results are represented as number of cells/cm2 over time (hours). D- Western blot analysis of NCad and VECad levels in IC2 neg, IC2 FL, IC2 ΔERM and IC2 ΔTAIL endothelioma lines and heart tissue from WT and IC2 deficient mice (ko). VECad and NCad were detected using mAb BV13 and mAb Cl32, respectively. Error bars indicate mean ± s.e.m., n = 3. E- Analysis of ICAM-2 and NCad distribution in IC2 FL (a-c), IC2 neg (d-f), IC2 ΔERM (g-i) and IC2 ΔTAIL (j-l) cells. ICAM-2 was stained with mAb 3C4 anti-mouse ICAM-2 followed by anti-rat AlexaFluor488 (Green). NCad was stained with mAb Cl32 anti-NCad followed by anti-mouse AlexaFluor555 (Red). Nuclei were stained using TOPRO-3 (Purple). Bar = 25 μm. F- Inhibition of NCad expression in IC2 FL cell line by siRNA resulted in disruption of cell-cell contacts and altered cell morphology. (a)- Phase contrast image of scrambled siRNA (a) and NCad siRNA (b) 48 hours post-transfection, Bar = 150 μm. (b)- Localization of ICAM-2 and NCad in IC2 FL cells treated with 48 hours scrambled (a-c) or NCad siRNA (d-f).
