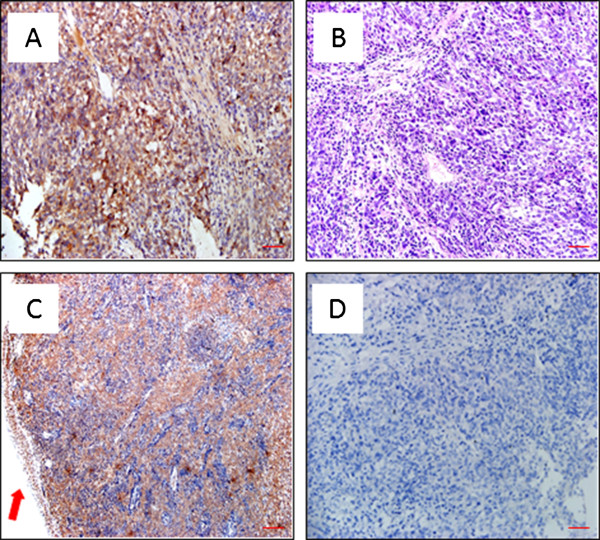
Figure 1.

STC2 expression in tumor adjacent nasopharyngeal epithelia with normal morphology and carcinoma cells as determined by immunohistochemistry studies. A: STC2 expressed in local tumor (× 200). B: Traditional HE staining, NPC, (× 200). C: STC2 was overexpressed in the tumor zone (× 100). D: Negative Control: NPC tissue stained at the same conditions except that no specific antibody (anti-STC2) was added (× 100). Scale bar: 50 μm in A and B; 100 μm in C and D.
