
Figure 2.
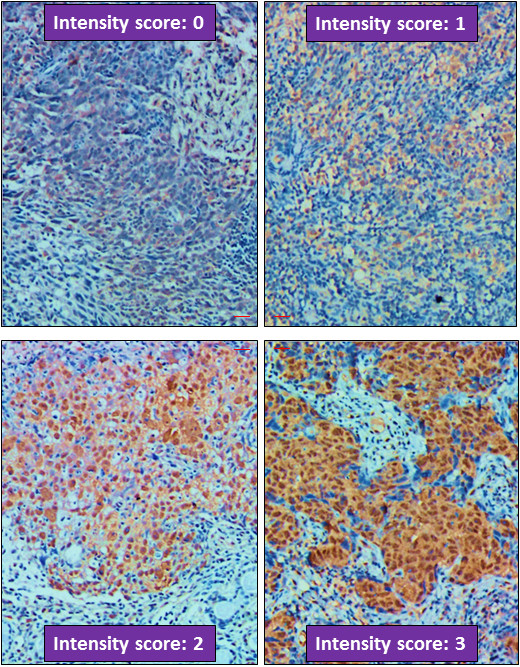
Criteria for STC2 expression intensity scoring. Representative micrographs were shown as labelled (× 200). All micrographs were taken and processed at identical conditions. Scale bar: 50 μm.
Official websites use .gov
A
.gov website belongs to an official
government organization in the United States.
Secure .gov websites use HTTPS
A lock (
) or https:// means you've safely
connected to the .gov website. Share sensitive
information only on official, secure websites.
Criteria for STC2 expression intensity scoring. Representative micrographs were shown as labelled (× 200). All micrographs were taken and processed at identical conditions. Scale bar: 50 μm.