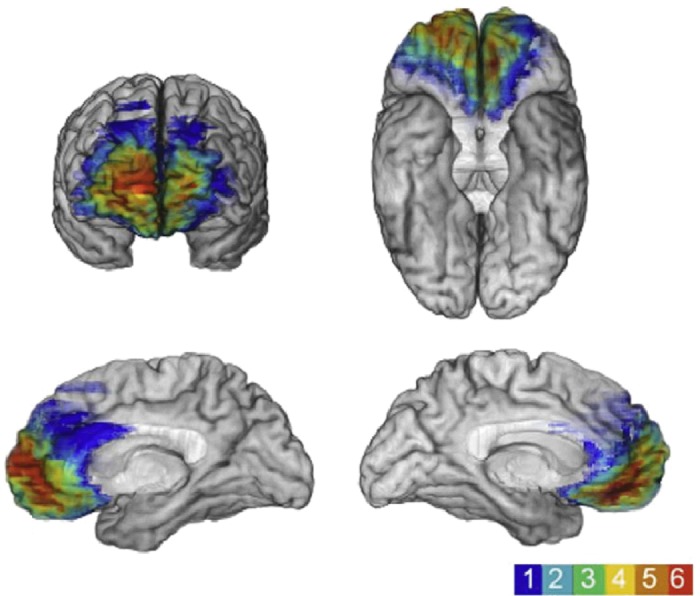
Figure 8.

Data from six patients with medial frontal lesions are shown from Gupta et al. (2012; reproduced with permission from Elsevier). The colour bar to the lower right indicates the amount of overlap in the lesions, with red depicting the area of overlap across all patients. This maximal overlap region corresponds to the part of vmPFC that is usually engaged during fMRI in healthy participants when they recall autobiographical memories (see Fig. 7). Different views of the lesions are shown, as follows: upper left, a coronal view; upper right, a view of the underside of the brain; and lower left and right, medial sagittal views.
