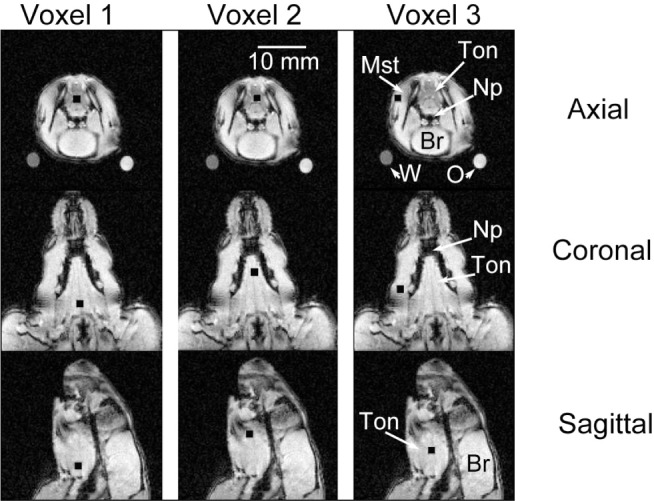
Figure 1.

Location of voxels in representative obese Zucker rat. The exact location of three voxels (black squares) that were studied using the spectroscopy protocol in nine magnetic resonance imaging (MRI) slices from a single obese rat are shown. The first column shows the location of the first magnetic resonance spectroscopy (MRS) tongue voxel (Voxel 1) in the axial, coronal, and sagittal views (rows labeled, far right); the second column shows the location of the second tongue voxel (Voxel 2); and the third column shows the location of the masseter muscle voxel (Voxel 3). The posterior tongue voxel was placed proximal to the hyoid bone. The second (anterior) tongue voxel was placed 2-4 mm anterior to the posterior voxel in the middle part of the tongue. The third voxel was placed in the masseter muscle, lateral to the mandible bone. Annotations on the third column of images show: Mst, masseter muscle; Ton, tongue; Np, nasopharyngeal airway; Br, brain. Calibration bar (second column) = 10 mm and applies to all images. In the top row the oil (marked “O”) and water phantom (marked “W”) show the cross section of the tubular glass phantoms as round dots outside the rat but within the images. These phantoms were used to calibrate the Dixon method for analysis of fat content in the Dixon spin-echo magnetic resonance images (images shown above are T1 weighted, scout images not Dixon protocol images; see supplemental material for details on the imaging protocols and analyses).
